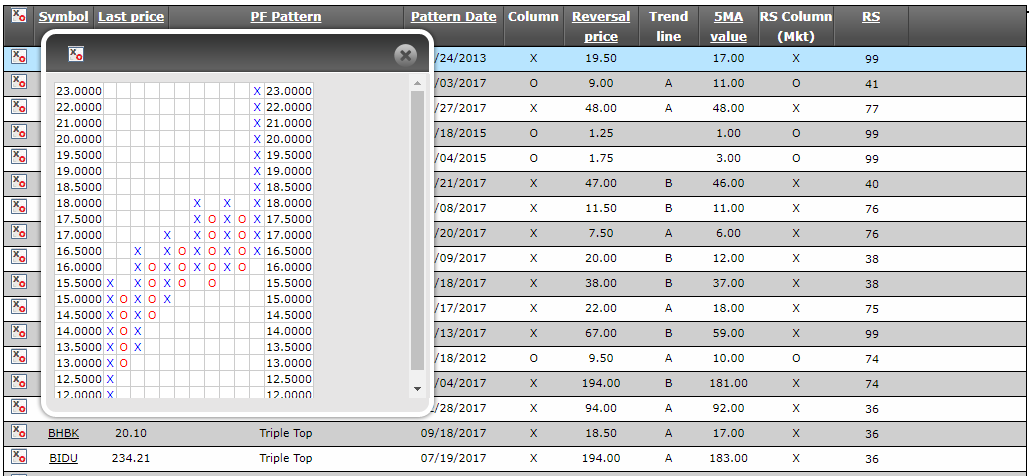
So in our online tool for P&F we have point & figure charts and an advanced pattern scanner. These are two fundamentals every successful P&F swing trader will need. First off I'll go through the pattern finder. Look at the scanner results pages in the pictures. It is a very clear and powerful tool, as you can see. We have the whole set of point and figure patterns that you can scan for - everything from buy signals and double tops to triangles and other more complex patterns.
The pattern scanner instantly gives you a list that meet your criteria that you have selected. I personally often scan for the triple bottom breakout and the triple top breakout, as I have found them to work the best for my swing trading strategy. The pattern scanner is really, really quick and delivers the stocks with the P&F patterns you choose. You can also add more criteria to the search, in order to refine your search. You can pinpoint stocks that meet any criteria that you like.
We have thumbnail charts that are shown in the pattern scanner. This saves you a lot of time, as you can have a quick glance on each of the charts to see if it looks good enough for a more detailed analysis.


This is what our point & figure charts and point and figure patterns scanner look like. As you know the Point and figure method is not a time-related approach. It might take a single day to draw an X, or it could take a week or a month. Of course, with intraday P&F charts you could even get changes for every tick.
The nice thing about P&F charts is that if the price just stays stagnant, you will not get a lot of drawings on the chart. That kind of boring stagnant price moves, or market noise, is simply filtered out with P&F. But then all of a sudden, when price really starts to move again, you will immediately get new X's or O's in your chart. This is one of the best time to enter trades. You will instantly get a break out pattern on the chart, which signals you to enter your positions.
Once you click one of the symbols, you are taken to the bigger, more advanced P&F chart. In this page you have many different options to add to your charts, like automatic P&F trend lines and moving averages. You can choose to display the chart using a defined box size, a predetermined price scale, or a logarithmic price scale - the percentage price scale.
I want to point that out that these tools that I am presenting in this article are available to you online, so there is no software that needs to be installed or anything. It is available in your web browser on your PC or your Mac. It works just as well on your iPhone, iPad or Android phone or tablet.
So the beauty of our online P&F scanner is that it will provide a list of stocks that are currently breaking out through support or resistance. You can then glance through the results, and finally analyze the best charts in more detail. All within seconds or minutes.
Imagine the time savings you will have with this tool, and think about how easy it is to find winning stocks to trade!
It is now time that you take a look at the online point and figure charts platform.


